Table of Content

- Jessica Robinson
- Aug 11,2026
Corporate disputes involve thick stacks of financial spreadsheets, complex liability arguments, and overlapping contracts. Parties step into mediation sessions feeling overwhelmed by dense technical evidence. Sorting through hundreds of pages under tight deadlines creates friction.
Settlement negotiations require clear communication to succeed. Simple visual presentations help all sides absorb core facts without getting lost in technical legal jargon. Clear visuals keep discussions focused on resolving issues.
Corporate litigation brings multiple business entities into 1 room. Visual organizational charts lay out ownership structures and contractual relationships in a single glance. Clear diagrams identify key parent companies, affiliates, and subcontractors immediately.
Distinguishing parent companies from subsidiaries keeps discussions grounded in actual liability limits. Incorporating custom legal graphics for trial and mediation makes multi-tier corporate hierarchies immediately clear to neutral mediators. Clarity prevents wasted time arguing over basic organizational facts during limited negotiation windows.
Legal teams spend less energy explaining simple background facts. Everyone remains focused on reaching a practical financial compromise. Visual clarity helps build consensus early in the day.
Business disputes usually develop across months or years of email chains, board meetings, and product shipments. A linear timeline map places key events in clear chronological order. Grouping critical dates gives everyone a shared factual baseline.
A legal analysis notes that when parties attempt to communicate complex facts or timelines, relying on spoken words alone often falls short. Visual chronologies allow both sides to track critical events side-by-side without confusion. Spotting key gaps in the timeline becomes much easier.
Interactive digital timelines let mediators click on specific dates to open related exhibit documents. The setup keeps technical evidence organized throughout long settlement sessions. Legal teams save time by displaying relevant evidence in seconds.
Damages calculations represent 1 of the most contested parts of any corporate mediation. Presenting raw accounting spreadsheets leads to confusion rather than agreement. Decision makers struggle to digest dense rows of accounting numbers.
Industry guidance explains that trial graphics clear up complex information by breaking down dense ideas into simple visual concepts. Bar graphs and waterfall charts show projected profits versus actual losses in a straightforward format. Seeing financial data in a visual format removes ambiguity.
Clear visual aids assist decision makers in evaluating risk accurately. Seeing realistic loss figures side-by-side encourages parties to make practical financial concessions. Parties move closer to a middle ground when figures are plain to see.
Patent disputes and construction defect claims involve intricate technical processes. Step-by-step technical diagrams turn complex engineering concepts into simple visual steps. Breaking down mechanisms helps non-experts grasp technical operations.
Trial presentation research highlights that effective graphics help decision-makers absorb dense information by breaking down key operational details. Detailed 3D renderings or flowcharts reveal where a process failed. Clear pictures replace lengthy verbal descriptions of machinery.
Clear diagrams reduce debate over how a system operates. Parties can direct energy toward resolving liability and setting realistic monetary values. Technical clarity keeps negotiations moving productively.
Preparing visual presentations requires careful attention to clarity and organization. Visual assets must focus on core disputed issues rather than cluttering the screen with unnecessary detail. Concise slides convey key messages much better than crowded designs.
Effective presentation materials follow strategic design principles:
Clean visual slides keep discussions moving forward efficiently. Neutral mediators can steer conversations back to key settlement terms when talks stall. Well-organized visual aids maintain control over presentation pacing.
Digital presentation tools allow legal teams to adjust graphics in real time during mediation. Adjusting dynamic damage charts during caucus sessions helps illustrate new settlement proposals on the spot. Instant updates clarify changing settlement offers instantly.
Visual tools turn abstract monetary figures into tangible settlement options. Parties can see how altering 1 variable changes the entire financial outcome. Viewing interactive calculations helps parties test settlement scenarios quickly.
Fast visual updates keep momentum alive during long negotiation sessions. Resolving factual confusion early creates a clear pathway toward a signed agreement. Parties leave mediation with a shared understanding of the final deal terms.
Visual strategies transform complex corporate mediations by turning dense technical records into clear narrative points. Decision-makers can evaluate exposure, understand complex liability claims, and make realistic settlement choices. Clear communication reduces friction during high-stakes corporate disputes.
Investing in high-quality presentation materials helps legal teams communicate position points with maximum clarity. Clear visual communication bridges the gap between complex legal arguments and successful mediation agreements. Teams gain a strong advantage when presenting clean, accessible visuals.
Visual strategies simplify complex legal, financial, and technical information, helping mediators and decision-makers understand important facts without becoming overwhelmed by lengthy documents or technical terminology.
Common visuals include organizational charts, chronological timelines, financial graphs, damages models, flowcharts, technical diagrams, comparative graphics, and interactive presentation materials.
Timelines organize important events in chronological order, making it easier for parties to identify key facts, gaps, disputes, and relationships between events without reviewing hundreds of pages of documents.
Charts such as bar graphs and waterfall charts transform complicated financial calculations into easily understandable visual comparisons. This can help decision-makers evaluate losses, risks, and potential settlement outcomes more effectively.
Yes. Technical diagrams, flowcharts, and 3D renderings can explain complicated systems, engineering processes, or alleged failures in a way that non-technical participants can understand quickly.

Discover how banner stands improve brand recognition at trade shows, conferences, and business events. Learn how effective banner design, strategic placement, and consistent branding increase visibility, attract attendees, and create memorable experiences that strengthen your brand's presence.
Read More
Hunting can offer an unconventional approach to team building by placing coworkers in outdoor environments where communication, trust, planning, and adaptability matter. Unlike traditional corporate activities, shared field experiences create opportunities for teams to solve practical challenges together, develop stronger relationships, and understand each other’s strengths. From documenting experiences in a hunt journal to navigating unpredictable terrain, these activities can reinforce valuable workplace skills. This guide explores how hunting-based team building can improve collaboration, break down workplace hierarchies, and create lasting team camaraderie.
Read More
Major industry events give businesses a valuable opportunity to build visibility, connect with decision-makers, and strengthen market authority. Successful event representation requires careful planning, from defining measurable goals and selecting speakers who understand the company culture to budgeting wisely and booking talent early. Well-trained staff, interactive presentations, and consistent brand messaging create stronger attendee experiences. However, the work does not end when the event closes. Fast, personalized follow-up helps turn valuable event connections into lasting business relationships and sustainable growth opportunities.
Read More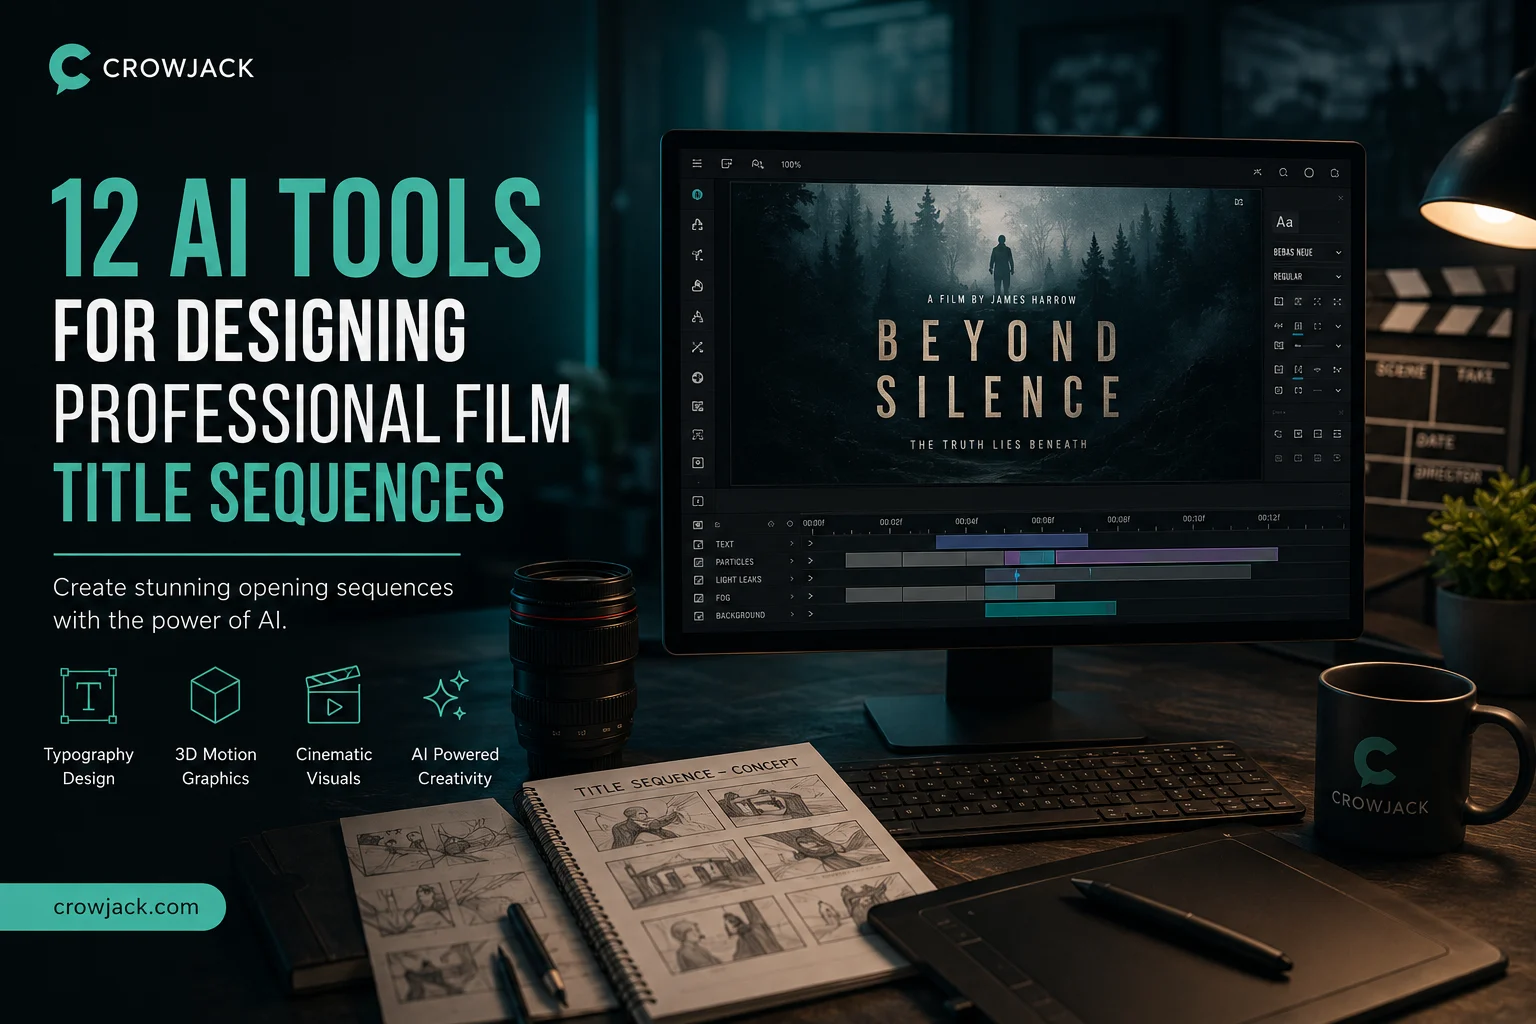
This guide explores 12 AI-powered tools for creating professional film title sequences, covering typography, motion graphics, 3D animation, cinematic backgrounds, storyboarding, and visual development. From industry-standard tools like Adobe After Effects and Cinema 4D to AI platforms such as invideo agent, Kittl, Luma Dream Machine, and Leonardo AI, each tool serves a different production need. Whether you need frame-accurate animation, distinctive typography, consistent visuals, or rapid concept development, this guide helps filmmakers and designers choose the right tool for their workflow.
Read MoreGet into details now? View all posts