The contemporary corporate world as we see is getting enormously competitive with each passing day. Besides, businesses are trying their best to compensate for the losses incurred by the unfortunate COVID-19 crisis that has gripped the world for more than two years now. Having said that, businesses are revamping their strategies and approaches to edge past their competitors.
This is where strategic planning and strategic management come into the picture. Each business has its unique vision and mission statements that it pursues in an uncompromising manner. Further, the vision and mission of a company inspire strategic long-term goals that are planned, executed, and measured with great efficiency. Needless to say, it takes a lot of research, analysis, and brainstorming to craft strategic plans that can add value to an organization.
Table of Contents
For that, business leaders use effective strategic planning tools and models like PESTLE Analysis, SWOT Analysis, VRIO Analysis, and other models subject to the purpose of strategic analysis. Furthermore, organizations rely on an effective change management process to optimize their strategic plans by bringing positive changes.
If we look at it from the perspective of assessing the competitive positioning of a company’s products and services, the BCG Growth Matrix is an excellent analysis model applied by businesses to gauge the success of their product lines.
In this thoughtful article, we delve deep into the various layers of the BCG Growth Matrix to understand the importance of the model and also effective application of it. The subsequent sections present an elaborative description of all aspects linked to the BCG Matrix.
BCG Matrix Definition
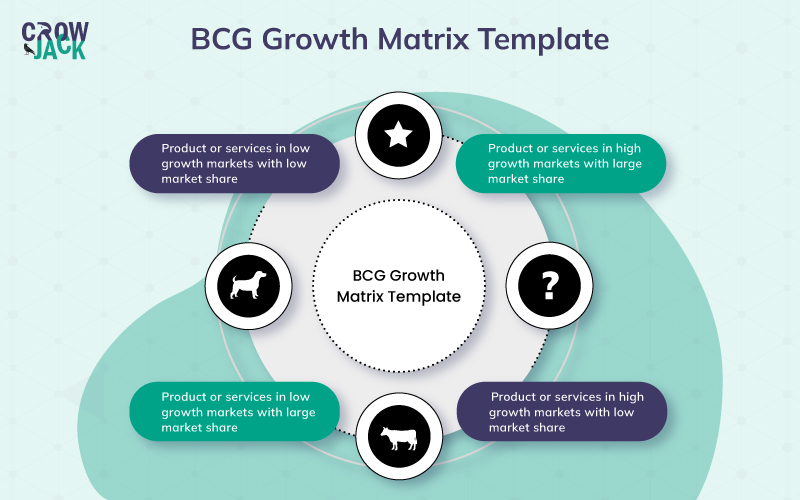
The BCG growth share matrix was proposed by the Boston Consulting Group in 1970 as a strategic planning model to visualize the success of a company’s products or services. To elaborate, the matrix uses graphical representations of products and services to help the top management identify which products perform the best and the ones that are underperforming. Consequently, the company can undertake effective planning in terms of backing products with greater investments, discontinuing the loss-making products, or altering the product portfolio. The BCG Matrix template is illustrated below.

To elucidate, the graphical representation of products and services in the BCG Matrix plots market share on the horizontal axis and the rate of growth on the vertical axis respectively. The matrix classifies products and services into the following four classifications also known as the 4 squares in the BCG Matrix Template.
- Stars
- Question Marks
- Cash Cows
- Dogs
Given below is an elucidation of each of these classes of products or services.
“Stars” Category
The products in the “Stars” category are the best performing products in terms of revenue generation, profitability, market share, and market growth. These products offer very high returns on investment and create great opportunities to explore new markets and scale in emerging economies. These can also be seen as the best-performing assets of a business.
Market Share: High
Market Growth Rate: High
Significance in strategic planning: With respect to strategic planning aligned with a company’s vision, the star products are of great significance. In fact, they closely follow the 80-20 Rule as more than 80 percent of revenue generation comes from these 20 percent products in the entire product line of a business. Having said that, companies should plan to add value to these products, invest more funds in these products and promote them with the most effective marketing strategies. With these products, companies can penetrate new markets in a worthwhile manner and offer higher profitability.
“Question Marks” Category
The next category includes products or services that have the potential to attain an impressive market share but in the current scenario, the market for these products has considerable uncertainties. To explain, there is a lack of certainty creating doubts about whether the market will decline in the future or scale. Besides, these products also utilize a large amount of a company’s cash as the market share is low and market growth is high. It may also be the case that these products might be using the largest share of the company’s resources and expertise.
Market Share: Low
Market Growth Rate: High
Significance in strategic planning: From the viewpoint of strategic planning, the performance of products in this quadrant needs to be tracked in a continuous manner with well-defined key performance indicators. The company should evaluate the products closely to decide if the products needed to be continued. Besides, the company needs to plan effective strategies to reduce costs going into these products and to transform them into products offering unique propositions.
“Cash Cows” Category
The third category in the BCG Matrix includes “Cash Cows” which are basically the products that generate consistent cash flow for a business. To elaborate, these are the products that have a large market share and are well-established in consumer perception. With these products, companies can sustain their cash flows and evaluate growth in a convenient way as their growth patterns are highly predictable.
Market Share: High
Market Growth Rate: Low
Significance in strategic planning: Business leaders and strategic analysts need to find ways in which they can take advantage of the presence of these products in mature markets and hence, convert them into star products.
“Dogs” Category
Products in this category have low penetration in the market and the market growth is low as well. To elaborate, these products can lead to cash traps for companies as they draw high investments but have little to no growth adding to potential losses.
Market Share: Low
Market Growth Rate: Low
Significance in strategic planning: In terms of strategic planning, identifying products in the “dogs” category will help companies to decide on discontinuation of products and disinvestment to get out of the cash traps.
Going further, let us now comprehend how the BCG Growth Matrix can be applied in a stepwise manner. The ensuing section provides details of an effective application of the model.
Stepwise Application of BCG Growth Matrix
Organizational leaders and analysts can apply the BCG Matrix by following the steps cited below for optimized strategic planning and execution.
Defining the market
The first and foremost step while applying the BCG Matrix is to clearly define the market in which the products or services are being analyzed. Defining the market clearly will further establish the context of the analysis. Here, it is imperative to note that defining the market incorrectly will have drastic consequences in terms of the classification of products as per the above-mentioned criteria. To explain, the implications will be largely different when Apple iPhones are evaluated in the premium smartphone market and when the same is assessed in the budget-friendly smartphone market. This example clearly illustrates that defining the market in a wrongful manner can lead to misleading results.
Evaluate market share
As mentioned above, the graphical representation illustrated in the BCG Matrix plots relative market share on the horizontal axis. Hence, the next step in applying the BCG Matrix is to evaluate the relative market share.
To find relative market shares for plotting the BCG Matrix, you can apply the following formula.
Relative Market Share: Brand’s market share/ Market share of the largest competitor in the industry
Evaluate market growth rate
The next step is to evaluate market growth as the vertical axis of the BCG matrix plots market growth. For finding the projections and current positions in terms of market growth, various factual reports are available on the internet that can be used to scan relevant data. What is highly important is to rely on credible sources of data and information.
Plotting
Having evaluated the relative market share and the market growth rate, the next step is to plot units on the BCG Matrix with a market share on the vertical axis and market growth on the horizontal axis.
As you can see, it is quite simple to use the BCG Matrix for effective strategic planning with respect to an organization’s goals and SMART Objectives. Next, to get further clarity on the application of the matrix, let us apply this model to some real organizations to evaluate BCG Matrix examples.
BCG Matrix Examples With Application To Real Companies
BCG Growth Matrix of McDonald’s
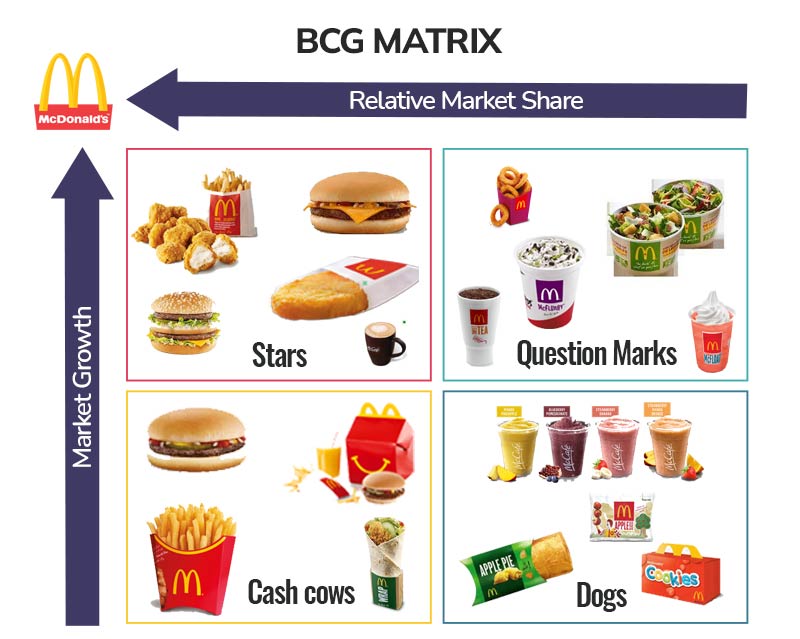
McDonald’s as we know is one of the leading quick-service restaurant brands with a massive global presence. The BCG Matrix of McDonald’s (in the Australian Market) will assess the product offerings of the company as per market share and market growth. The segmentation of McDonald’s products into the four quadrants of the BCG Matrix is illustrated below.

Defined Market: Australia
McDonald’s Star Products
The star products are those that have a large market share amid incremental market growth. For McDonald’s Australia, its star products as per Dailymail include Cheeseburgers, Golden Hash Brownies, Big Mac Beef Burger, McNuggets, and McCafe Cappuccino.
McDonald’s Question Mark Products
These are the products that have a low market share. For McDonald’s Australia, the category of “question market products” includes onion rings, green salads, McFlurry, desserts, and teas.
McDonald’s Cash Cows
These are the products with relatively lesser market share in comparison to star products but these products generate regular cash flow. For McDonald’s Australia, the cash cows include french fries, beef burgers, happy meals, and wraps.
McDonald’s Dogs
Apple pie, apple slices, frozen cold drinks, and cookies fall in the Dogs category for McDonald’s Australia. McDonald’s should look to discontinue these products as the market growth is very low and the market share is also next to negligible.
An illustration of McDonald’s Australia BCG Matrix is presented below
BCG Growth Matrix of Toyota
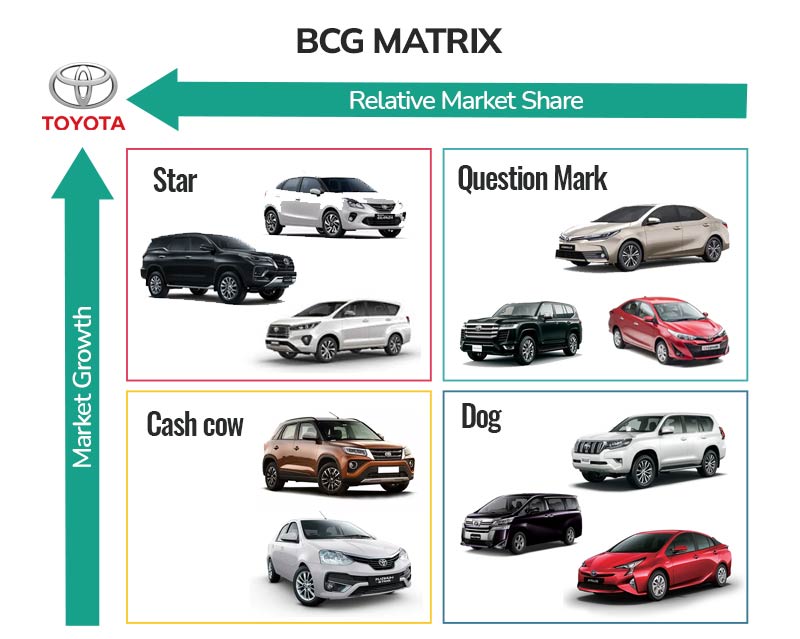
Toyota is a globally successful Japanese automotive manufacturer that has a dominant presence in different parts of the world. In fact, with a brand value worth $ 59.5 billion, Toyota tops the list of the world’s most valuable automotive brands. Given below are the BCG matrix quadrant divisions of Toyota with respect to the Indian Market.

Defined Market: India
Toyota’s Star Products
With respect to the Indian market, Toyota’s star products that have a high market share include Innova Crysta, Glanza, and Fortuner primarily as per Statista. These products are offering a high ROI to the company in the Indian market and helping the brand gain competitive advantages.
Toyota’s Question Mark Products
In this category, for Toyota, the cars with an uncertain future for their segments include Yaris, Corolla, and Land Cruiser. Potentially, these are great cars with luxury features but there are large uncertainties that prevail.
Toyota’s Cash Cows
Toyota Etios and Urban Cruiser are the cash cows for Toyota in the Indian market and if these cars are optimized in terms of features, safety, and other specifications, they do have the potential to emerge as cash cows in the middle-income segment that forms the largest section of car consumers in India.
Toyota’s Dogs
With respect to the Indian automotive market, Toyota Prius, Toyota Prado, and Toyota Vellfire are the cars that Toyota should look to discontinue in India.
An illustration of Toyota’s BCG Matrix with respect to the Indian market is presented below
BCG Growth Matrix of Reckitt Benckiser’s Brands
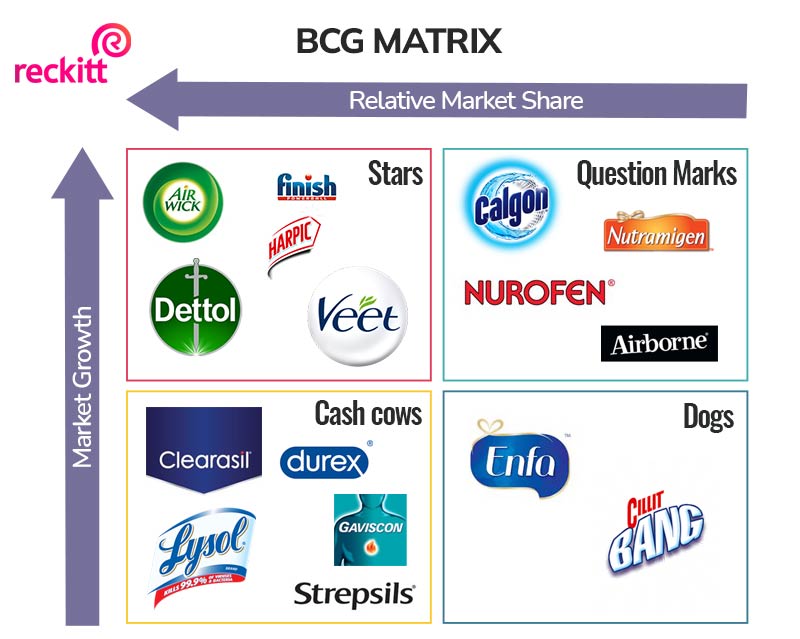
Reckitt and Benckiser is a British consumer goods company with its operations spread all across the globe. Further, Reckitt and Benckiser Group has various brands under its conglomerate. The BCG matrix illustrated below sheds light on the classification of the group’s brands in the European market.

Defined Market: European Market
Reckitt and Benckiser’s Star Brands
These are the brands that offer the highest returns to the company in terms of cash flow and market penetration. For the company, its star brands include Finish, Airwick, Dettol, Veet, and Harpic. As per insights from Reuters, Finish, Veet, Airwick and Harpic generate around 70 percent sales for the company.
Reckitt and Benckiser’s Question Mark Brands
For Reckitt and Benckiser, the brands that have a rather uncertain future include Airborne, Nurofen, Calgon, and Nutramigen.
Reckitt and Benckiser’s Cash Cows
Brands inclusive of Vanish, Durex, Strepsils, Clearasil, Lysol, Gaviscon, and are the cash cows for Reckitt and Benckiser. These products have fixed cash flow patterns and generate regular revenue for the brand being essential products.
Reckitt and Benckiser’s Dogs
The brands that the company should possibly look to discontinue include Enfa and Cillit Bang.
An Illustration of Reckitt and Benckiser’s Brands BCG Matrix Is Given Below
To conclude, the BCG Growth matrix is a highly influential strategic planning tool that helps companies understand which products in the product line are aligned with the strategic vision of the company. Having said that, companies can plan to boost investments in the outperforming products, improve the performance of products with considerable market share and disinvest in products of brands that are liabilities for the company.
FAQs
What are the limitations of the BCG Matrix?
The BCG Matrix has some limitations, such as oversimplifying the complexities of real business scenarios, focusing only on two factors (market growth rate and market share), and not considering other critical factors like competitive dynamics and industry trends.
Can the BCG Matrix be used for diverse industries and sectors?
While the BCG Matrix was initially designed for use in the context of diversified businesses with multiple products or business units, it can also be adapted and applied to specific industries and sectors to gain insights into their strategic planning and resource allocation. However, modifications may be necessary to suit the unique characteristics of each industry.

 Proof Reading
  Copy Writing
  Resume Writing
  Blogs
Blogs Guides
 SOP's
SOP's Student Resources
 Research Topics
 Login
Login Register